Why we built an interactive ServiceNow Capability Map
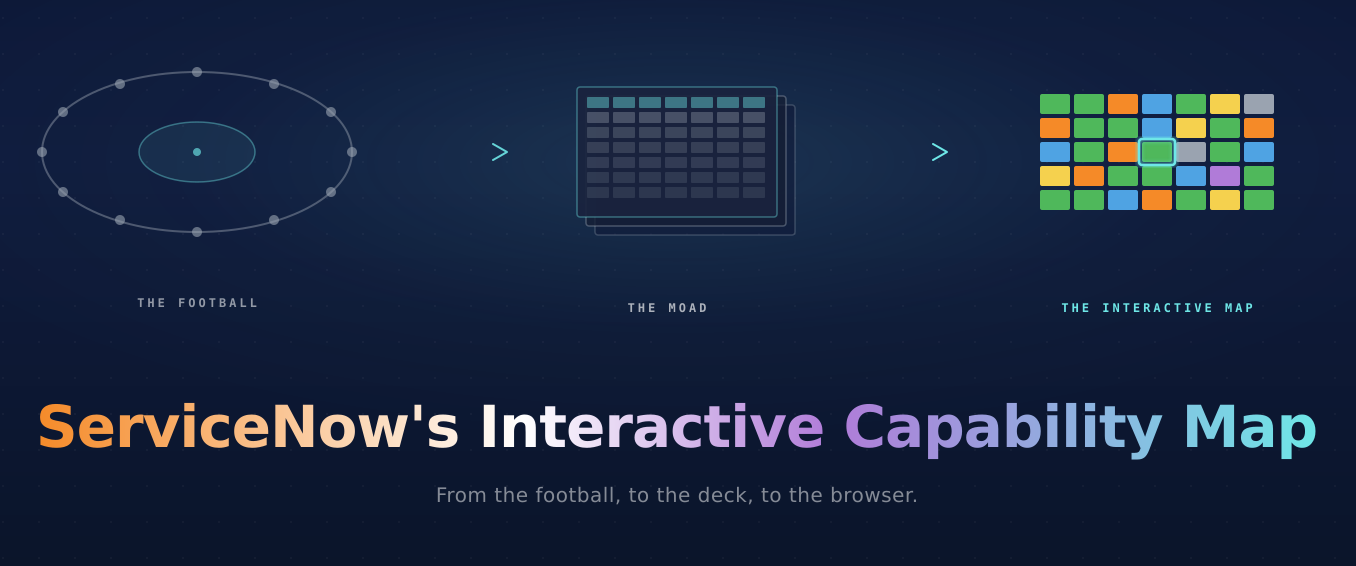
If you've spent as many years as we have in the ServiceNow ecosystem, you know "the football." It's the picture every customer has seen, and it has never sat still.
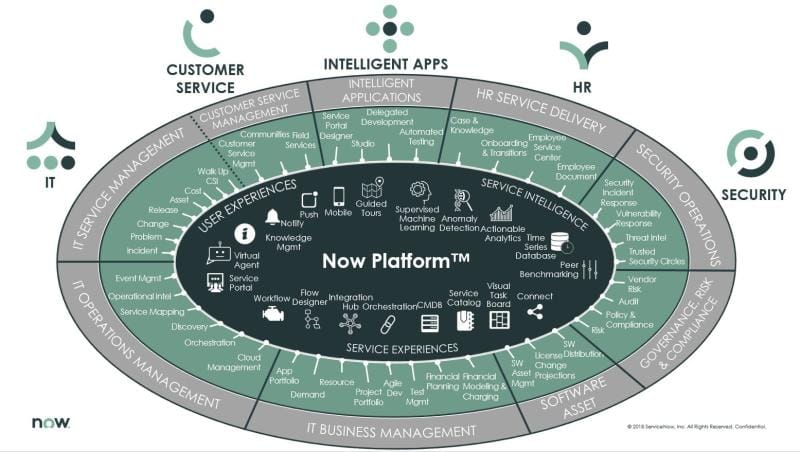
Every implementation or sales call starts with it, and every platform release reshapes a corner of it, and the version a customer is holding in their head is almost never the version on the slide in front of them.
Eventually the football got too crowded. The picture that took its place for most partners is the MOAD: the mother of all decks. Luca Morlupi has built (and more impressively, maintained) a Capability Map slide inside the MOAD that laid every product family, container, and sub-container out flat, all visible at once. It became the picture most partners (us included) reached for.
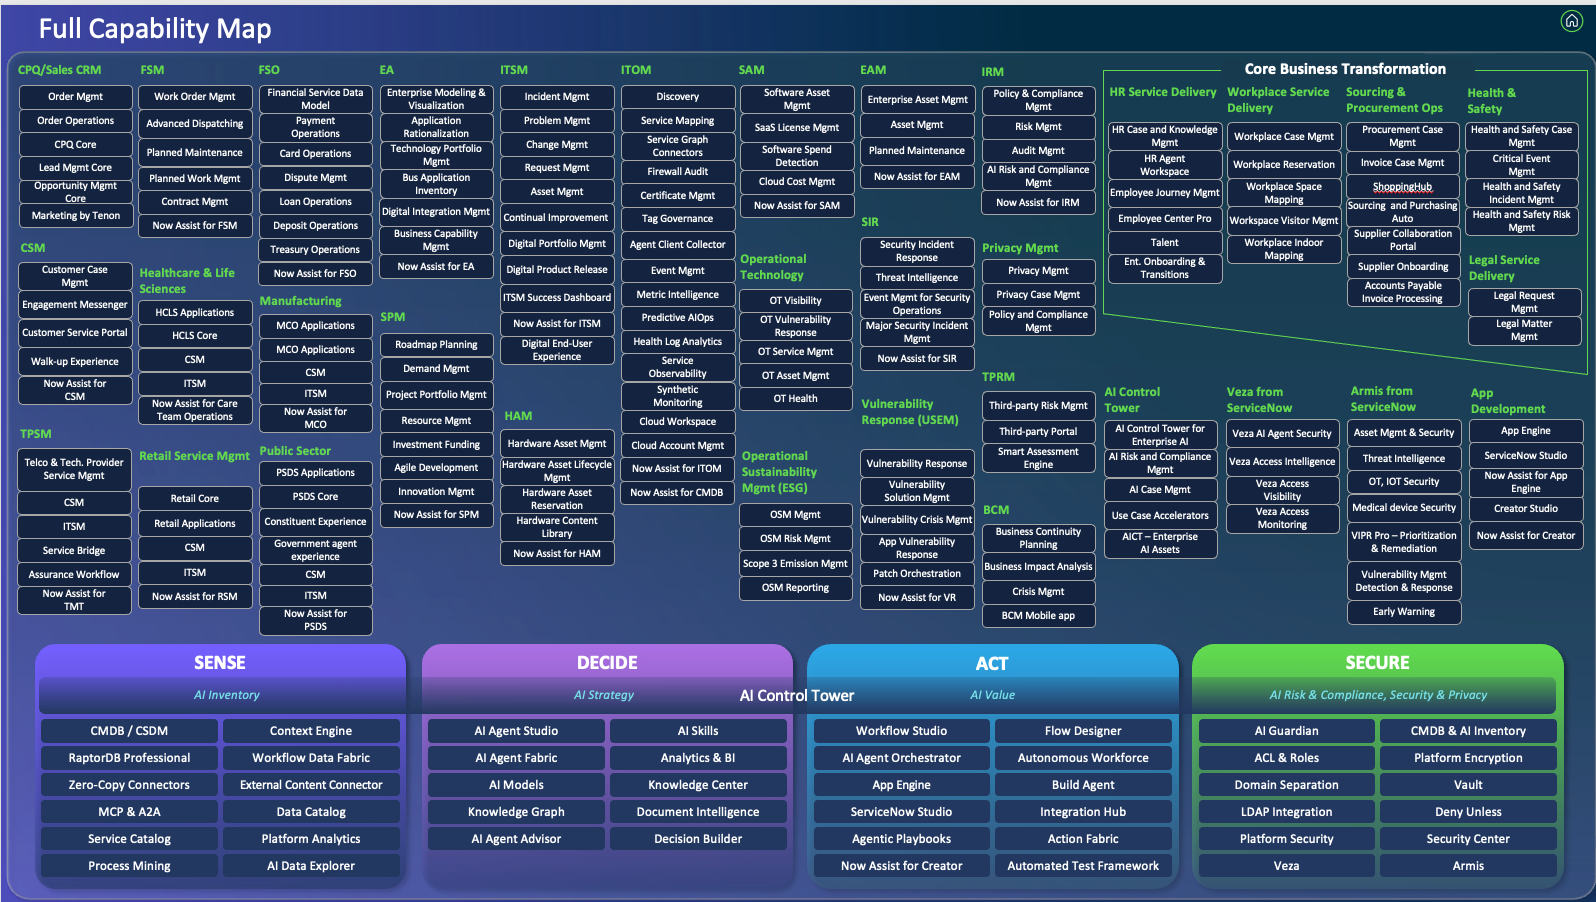
It's the best static picture of ServiceNow that exists. But it's still a slide. Every time ServiceNow ships a new family, re-parents an app, or moves a capability from one tower to another, the slide goes stale and the new shape doesn't migrate forward. Somebody has to rebuild it, every partner ends up with their own fork, and every customer engagement ends up with its own version of that fork. Twelve customers, twelve PowerPoint files, twelve subtly different shapes of the same map, each hand-colored to indicate what the customer is licensed for and what they actually use. None of them can be shared as a link. None of them stay current past the next family release.
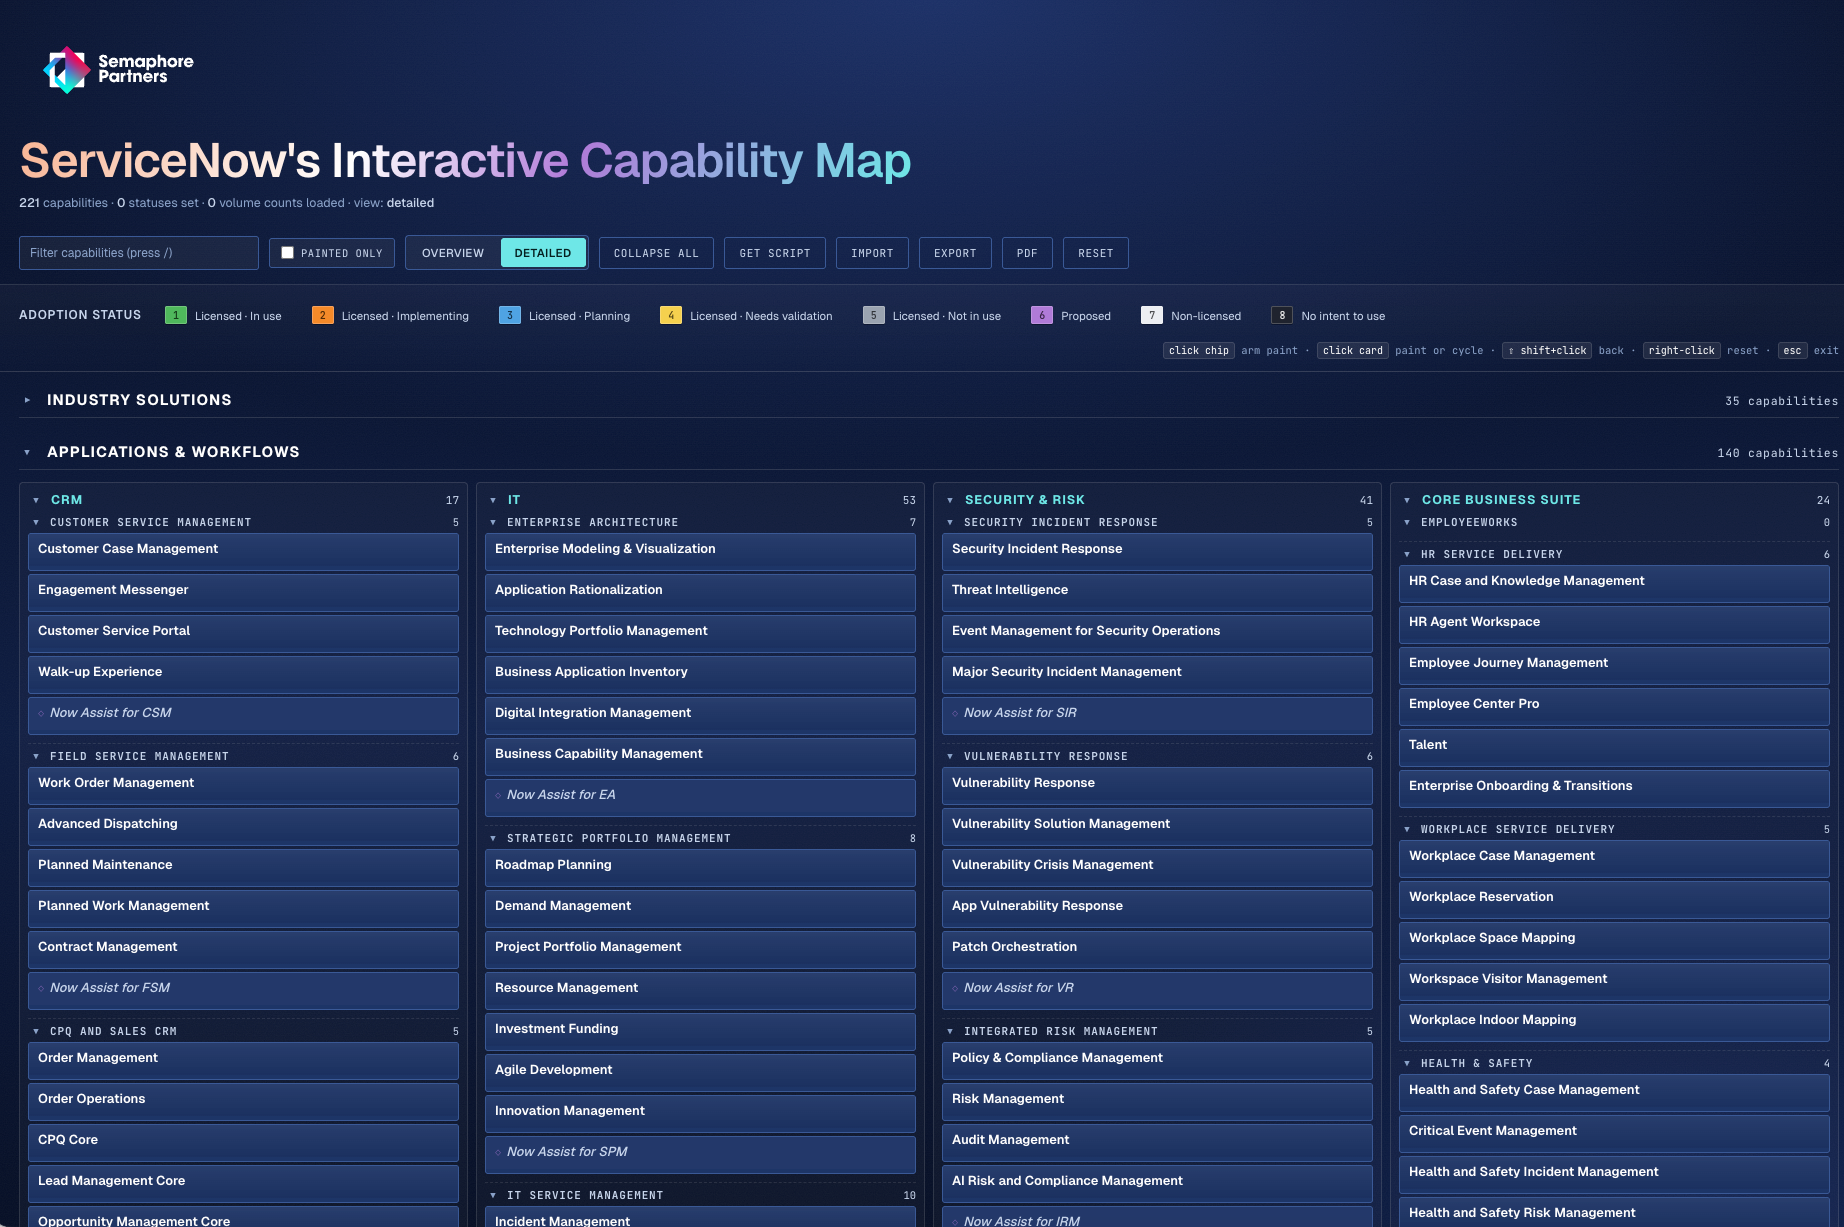
We got tired of that. Introducing our truly interactive capability map: https://map.semaphorepartners.com/
What we built
The Business Capability Map is a single-page site that renders the current ServiceNow product landscape as a paintable grid: Industry Solutions, Applications & Workflows, the AI Platform, the Core Platform. You can:
- Filter and search across every capability on the map.
- Paint each capability with an adoption status: Licensed · In use, Implementing, Planning, Needs validation, Not in use, Proposed, Non-licensed, No intent to use.
- Export the painted map as JSON to put a pin in it for the next conversation.
- You can also import the output of a background script that runs in the customer's own instance, so the map populates itself from the source of truth instead of from memory.
The populator counts records across each capability's tables for the last twelve months, so you see real usage rather than license state alone. One paste, the map lights up.
When ServiceNow ships the next family release and the shape of the map changes, the site changes with it. The painted statuses carry forward against the new shape. No version of the deck has to migrate.
Why this matters for partners
A few things change once the map lives at a URL instead of in a file.
One canonical version. ServiceNow reshapes the "football" constantly: a new family appears, an app gets re-parented, a capability slides from one tower to another. When that happens, we'll update the map in one place and every conversation in flight benefits. No more "wait, is this the deck from before the last release?" Partners stay aligned with each other instead of each carrying a private mental model.
Sales conversations get sharper. Walking into a new customer, we can pull up the map, paint their licensed entitlements in one color, and immediately see the gap between what they bought and what they're actually running. Licensed · Not in use is the most expensive color on the board, and usually the most interesting one in a renewal or expansion conversation.
Discovery becomes a conversation. Instead of asking the customer to fill out a survey before the workshop, we paint together. Hover over a tile, see the twelve-month record count, and let the customer tell us why the number is what it is. When we paint something Needs validation, we're not flagging a hole. We're agreeing to come back next round with data.
The artifact survives the meeting. A painted map exports cleanly, lives at a URL the account team can revisit, and is the same thing the customer opens next quarter. PPT decks don't survive. They fork.
What's next
This is a v1, and the way it evolves should depend on what's actually useful in front of customers. A few things on the near-term list:
- Tighter SKU-to-tile mapping, especially for Industry Solutions where licensing is messier than the picture suggests.
- Snapshots, so a painted map can be saved and compared against next quarter's.
- A "what changed" overlay when ServiceNow ships the next iteration of the football, so we can see at a glance which tiles moved.
If you've used the map in a customer meeting, tell me, especially if something fell flat or something landed surprisingly well. The whole point of moving off PowerPoint is that we iterate on the same artifact instead of building eleven versions of the same one. This post will move with it.